

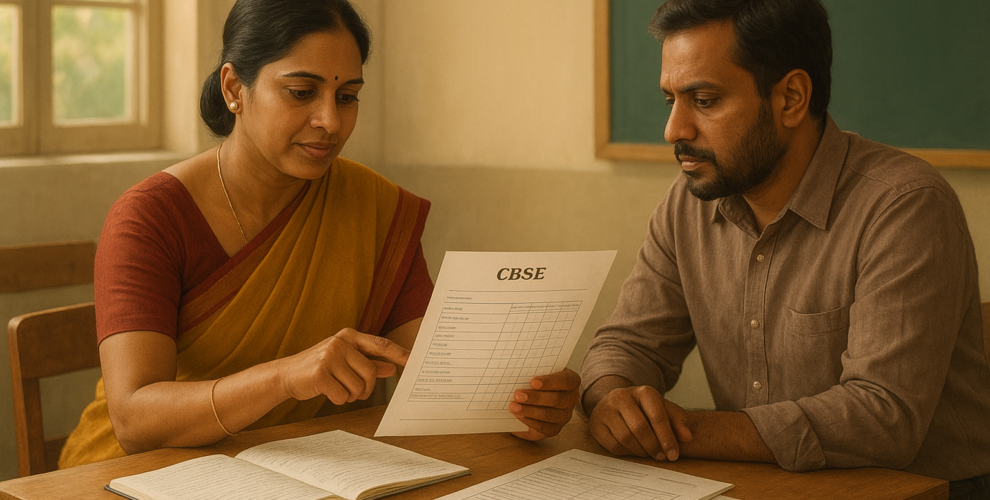
By Ritika Sharma, Head of Academics (Senior School), GD Goenka Public School Sonepat
CGPA stands for Cumulative Grade Point Average — the average of the grade points a CBSE student earns across the five main subjects, measured on a 10-point scale where A1 equals 10 and E equals a below-grade result. If your child brought home a report card showing a 9.2 and you are not sure whether that is good, whether it converts to 87% or 92%, or why the sixth subject is not part of the number at all, this is the explanation our own Class 10 team gives parents at GD Goenka Public School Sonepat every March.
What the Number on the Report Card Is Actually Measuring
CGPA is not a percentage in disguise. It is a grade-point average, and CBSE deliberately built it that way after 2011 to reduce the pressure of chasing single marks and to compress a wide spread of scores into nine grade bands. Each of the five main subjects gets a 9-point letter grade — A1, A2, B1, B2, C1, C2, D, E1, E2 in the old scheme, now commonly shown as A1 through E — and each letter carries a fixed grade point from 10 down to 4 (E grades are recorded as qualifying but do not carry forward into the CGPA calculation the way a numeric fail would on a percentage system).
The CGPA itself is simply: add the grade points of the five main subjects, divide by 5. That is the entire formula. There is no weighting, no subject carries more influence than another in the core average, and there is no rounding trick hidden inside it — a fact that surprises most parents on their first read of a CBSE report card.
The CBSE Grade Point Table, and How It Maps to Marks
CBSE publishes the grade-marks band on the academic side of its own site, and it has stayed stable since the 2017 revision. Below is the table our front office hands to every Class 9 parent at the start of the session, because it is the one document that removes 90% of the CGPA confusion in a single read.
| Grade | Marks Range | Grade Point |
|---|---|---|
| A1 | 91–100 | 10 |
| A2 | 81–90 | 9 |
| B1 | 71–80 | 8 |
| B2 | 61–70 | 7 |
| C1 | 51–60 | 6 |
| C2 | 41–50 | 5 |
| D | 33–40 | 4 |
| E | Below 33 | Qualifying, not graded |
A Worked Example, From an Actual (Anonymised) Report Card
We analysed report cards from our last three Class 10 batches to build a specimen that reflects a real, slightly uneven spread rather than a textbook-perfect one, because that is what most families are actually holding when they call the front office. Here is one, with the name removed:
| Subject | Marks | Grade | Grade Point |
|---|---|---|---|
| English | 92 | A1 | 10 |
| Hindi | 88 | A2 | 9 |
| Mathematics | 79 | B1 | 8 |
| Science | 95 | A1 | 10 |
| Social Science | 90 | A2 | 9 |
Add the five grade points: 10 + 9 + 8 + 10 + 9 = 46. Divide by 5 subjects, and the CGPA is 9.2. That single figure is what shows up on the top line of the report card and the one colleges and forms ask for — but notice that Mathematics, at grade point 8, is quietly two full points behind the strongest subject. A flat 9.2 built from five even A2 grades and this 9.2 built on one weaker subject are the same headline number and two different academic pictures. We come back to why that distinction matters below.
The Five-Subject Rule — and What Happens to the Sixth
This is the single most common misunderstanding we field from parents, according to the front-desk log our counsellors keep every admission season. CBSE’s Class 10 CGPA is calculated on exactly five subjects: the two languages and the three core subjects — Mathematics, Science and Social Science. A student who has opted for a sixth, additional subject (commonly Information Technology, Artificial Intelligence, Painting or a vocational subject at GD Goenka Sonepat) does not have that subject folded into the CGPA average at all.
The sixth subject’s grade is recorded separately on the report card and can be used in one specific circumstance: if a student’s grade in one of the five core subjects is lower than the grade in the sixth subject, CBSE allows the better-performing additional subject to replace the weakest of the five core subjects for CGPA purposes — never the other way around, and never to inflate a CGPA that is already built from five strong grades. In our experience this rule quietly rescues a handful of students each year whose sixth subject (often IT or Painting) turns out to be their strongest grade, and almost nobody realises the swap is available unless a teacher points it out.
Converting CGPA to a Percentage — the ×9.5 Multiplier, and Its Real Limits
CBSE’s own guidance, issued when the grading system launched, gives one approximate conversion: multiply the CGPA by 9.5 to get an indicative percentage. A 9.2 CGPA becomes roughly 87.4%. CBSE itself has been explicit, including in circulars on its academic portal, that this is an indicative formula for administrative use, not a certified equivalence, and several universities and scholarship portals have started asking for CGPA directly rather than accept a converted number.
The ×9.5 figure is not arbitrary. It comes from CBSE’s own analysis of the historical spread between grade-point averages and the marks students who earned each grade actually scored, averaged across a large national dataset, at the point the grading system replaced marks-based Class 10 reporting. Two things follow from that origin, and both matter more than the multiplier itself: first, the formula compresses at the very top and bottom of the scale — a 10 CGPA “converts” to 95%, but almost no student’s actual five-subject average sits exactly at 95%, so the top end slightly understates strong performers. Second, at the low end, a 4 CGPA converts to 38%, which sits inside the D-grade marks band rather than reflecting any one subject’s real score. Treat the conversion as a planning estimate for a form that demands a percentage, never as the number that replaces the CGPA on a transcript.
Subject-Wise GPA vs Overall CGPA — Why the Detail Matters More Than the Headline
Parents read the CGPA line and stop. Our Class 10 team reads the subject-wise grades first, because that is where the actual academic signal lives. Two students can carry an identical 9.2 CGPA and be in very different positions heading into Class 11 stream selection. One has five grades bunched between A2 and A1 — a genuinely even, strong profile. The other, like the worked example above, has a B1 in Mathematics sitting under four A-grades — fine for CGPA, but a signal we flag directly to parents before a Science-with-Mathematics stream choice is finalised.
When we counsel a family on stream selection, we do not lead with the CGPA. We pull the subject-wise grade sheet, look at where the grade points are concentrated, and match that against two years of classroom performance data our subject teachers maintain — not just the one board-adjacent number a report card reduces everything to.
Internal Assessment, Periodic Tests, and the 20-Mark Component
The 100 marks behind each subject’s grade are not all board-exam marks. Under CBSE’s continuous and comprehensive framework, most Class 9 and 10 subjects carry an internal assessment component — typically worth 20 of the 100 marks — built from periodic tests, a notebook/portfolio component, and subject enrichment or practical work through the year, with the remaining 80 marks from the board or school-conducted final examination. This is precisely why a student’s grade point can move meaningfully between the first periodic test in July and the final CGPA in March: a strong internal assessment score cushions a subject that later has a rougher board paper day, and a weak one can pull an otherwise strong board performance down a full grade band.
On site, this is the piece we watch most closely through the year. When we tracked internal assessment trends across our last two Class 10 cohorts, the students whose CGPA moved up a full grade point between the mid-year and final report almost always had one thing in common: a deliberate push on the internal component — attendance at every periodic test, a complete practical file — not a sudden change in board-exam ability.
What a Class 10 CGPA Predicts About Class 12 — Honestly Stated
Parents often ask us whether a 9.2 in Class 10 means their child will score similarly in the Class 12 boards two years later, and the honest answer, based on what we have seen across our own cohorts, is: loosely, and less than most families assume. Class 10 CGPA reflects five subjects taken by every student on a common syllabus. Class 12 performance depends on stream choice, subject combination, a harder and more specialised syllabus, and — in our experience — a student’s study habits maturing (or not) over two years of adolescence that CBSE’s grading system has no way to capture in a single number.
What we have seen hold up reasonably well as a signal, across the batches our own subject teachers have followed from Class 10 into Class 12: a student’s subject-wise grade pattern, not the blended CGPA, correlates more with later stream performance. A student who carried an A1 in Mathematics into a Science-with-Mathematics stream choice has, in our data, a noticeably smoother Class 11 transition than one whose 9.2 CGPA was built on a Mathematics grade two bands lower, propped up by strong language grades. That is exactly the distinction a flat CGPA number erases and a subject-wise reading restores — one more reason our counsellors always ask to see the full grade sheet, never just the CGPA line, before a stream conversation.
How Colleges, Scholarship Forms and Foreign Applications Want the Conversion
Indian college admission portals increasingly accept CGPA directly and run their own conversion internally, so entering 9.2 rather than a converted percentage is usually correct and safer, since it avoids compounding CBSE’s own approximate multiplier with a second, unofficial one a form might apply. Scholarship portals are less consistent: some explicitly state “use the CBSE ×9.5 formula,” in which case write down 87.4% and keep the underlying CGPA in your documents for reference; others ask for CGPA as-is. Foreign university applications, particularly through UK and US common application portals, generally prefer the raw CGPA plus the official CBSE grading scale explanation, which most CBSE schools — including ours — will provide as an attested annexure alongside the transcript on request.
Our practical advice to Class 10 and 12 parents filling out any external form: read the form’s instruction line for the marks field before entering anything. If it says “percentage,” use the ×9.5 conversion and note “CBSE-converted” if there is a remarks field. If it says “CGPA” or “GPA,” enter the CGPA figure exactly as it appears on the CBSE-issued marksheet — do not convert it yourself and do not round it.
Where to Go Next at GD Goenka Public School Sonepat
Our academic CBSE curriculum framework page lays out how the five core subjects, the sixth-subject options and the internal assessment structure fit together year over year at our Sonepat campus, which is the natural next read once the grading mechanics above make sense. If you are weighing CBSE against another board for an incoming student, our comparison of CBSE, ICSE and IB in Haryana covers how each board’s assessment and reporting model differs from what is described here. Parents who want to speak directly with the subject teachers behind these grade patterns can review our faculty profiles, and families considering Class 9 or Class 11 entry can start with our admission process page.
A Second Specimen: Reading a Report Card That Needs a Closer Look
Not every CGPA conversation at our front office is about a strong report card. Here is a second, less rosy specimen from the same anonymised data set, because a 6.4 CGPA raises different questions than a 9.2 does, and parents deserve the same subject-by-subject read either way.
| Subject | Marks | Grade | Grade Point |
|---|---|---|---|
| English | 68 | B2 | 7 |
| Hindi | 72 | B1 | 8 |
| Mathematics | 44 | C2 | 5 |
| Science | 58 | C1 | 6 |
| Social Science | 63 | B2 | 7 |
7 + 8 + 5 + 6 + 7 = 33, divided by 5 subjects gives a CGPA of 6.6. Converted at ×9.5, that is roughly 62.7%. On its own the CGPA reads as “middling.” Read subject-wise, it says something more specific and more useful: two humanities subjects sitting comfortably in the B band, and both Mathematics and Science trailing by two to three grade points. When we see this pattern in our own gradebooks — and we track it every term across every Class 9 and 10 section — it is almost always a signal to schedule additional Mathematics and Science support well before the Class 10 board year, not after the CGPA has already landed on a final report card with no time left to move it.
Common Report-Card Reading Mistakes We See Every Year
A few misreadings recur so often that our counsellors now address them proactively at the Class 9 orientation meeting, rather than waiting for a parent to ask.
- Treating CGPA as interchangeable with percentage on every form. As covered above, some forms want the raw CGPA and some want the converted figure — entering the wrong one can understate or overstate a student’s standing on a scholarship or admission application by several percentage points.
- Averaging six subjects instead of five. Parents who add up all six subject grade points, including the additional subject, and divide by 6 arrive at a CGPA that does not match the school-issued marksheet, and then call the office concerned that a mistake has been made. It has not — the sixth subject is excluded unless it is substituted in under CBSE’s replacement rule described earlier.
- Assuming the CGPA is rounded from raw marks the same way a percentage is. Grade points are stepped in bands of roughly 10 marks each. A student who scores 90 (A2, grade point 9) and a student who scores 81 (also A2, grade point 9) show identically on the CGPA even though they are 9 marks apart — the CGPA is deliberately coarser than a percentage, which is the entire design intent of a grading system rather than a marks system.
- Reading the CGPA the week report cards arrive and not before. The subject-wise grades that build the CGPA are visible through the year in periodic test results and the internal assessment component. Families who review those as they come in, rather than only at the final report, have far more time to act on a slipping subject grade than families who see the number for the first time on the final CGPA line.
If a Grade Looks Wrong: Our Verification Process
Occasionally a parent brings us a report card and a genuine concern that a subject grade does not match what a student’s notebooks and test scores through the year would suggest. Our process, consistent with CBSE’s own verification norms, is straightforward: we first re-check the internal assessment components (periodic tests, notebook submission, practical or portfolio marks) against our own subject-teacher records, since that is where a clerical total error is most likely to sit. If the internal components check out and the concern is about the board-conducted paper itself, CBSE’s own post-result services — verification of marks, and where applicable, re-evaluation — are the correct next step, and our exam cell assists families through that CBSE-run process directly rather than attempting to resolve a board-paper discrepancy in-house.
What We Tell Every Incoming Class 9 Family About the Two Years Ahead
By the time a family sits across from our counsellors with a Class 10 CGPA in hand, most of the academic pattern that produced it was already visible eighteen months earlier, in the Class 9 periodic tests. Our team’s standing advice to incoming Class 9 parents is to treat the first periodic test result, not the final Class 10 CGPA, as the number worth watching closely — because it is the one you can still act on. A subject sitting at a C1 or C2 grade point in the first Class 9 periodic test, addressed with a term of focused support, has time to move into the B or A band well before it is locked into a final CGPA that a college application will read two years later.
Frequently Asked Questions
Is a 9.2 CGPA a good score in CBSE Class 10?
Yes — a 9.2 CGPA sits in the A1/A2 band and, per the CBSE-indicated conversion, is roughly equivalent to 87.4%. Whether it is “good” for a specific stream or college cutoff depends more on the subject-wise grade sheet behind it than the CGPA alone, as explained above.
How is CGPA calculated in CBSE Class 10?
Add the grade points (on a 10-point scale) of the five main subjects — the two languages, Mathematics, Science and Social Science — and divide by 5. A sixth, additional subject is not included unless it replaces a weaker core-subject grade under CBSE’s substitution rule.
What is the CGPA full form?
Cumulative Grade Point Average — “cumulative” because it reflects the average across all five main subjects for the academic session, not a single subject or test.
How do I convert CGPA to percentage?
Multiply the CGPA by 9.5. This is CBSE’s own indicative formula, published on its academic portal, and is meant for administrative estimation — not a certified equivalence, particularly at the very top or bottom of the scale.
Does the sixth subject count in the CGPA?
Not by default. It only enters the calculation if its grade is higher than one of the five core-subject grades, in which case it can replace that weaker grade — never the reverse.
Does a high Class 10 CGPA guarantee good Class 12 results?
No. Class 10 CGPA reflects a common five-subject syllabus; Class 12 performance depends on stream, subject combination and two more years of study habits. Subject-wise grade patterns are a more useful early signal than the blended CGPA figure, based on what we have seen across our own Class 10 to Class 12 cohorts.
Should I write CGPA or the converted percentage on a college form?
Read the form’s field label first. If it asks for CGPA, enter the CBSE marksheet figure exactly; if it asks for percentage, use the ×9.5 conversion and note that it is CBSE-converted where a remarks field allows it.
GD Goenka Public School Sonepat is affiliated to CBSE (affiliation number 531123). Grading details above reflect CBSE’s published academic guidance; for the full grading scheme and examination bye-laws, see the CBSE and Ministry of Education academic portals.